- Like
- SHARE
- Digg
- Del
- Tumblr
- VKontakte
- Flattr
- Buffer
- Love This
- Save
- Odnoklassniki
- Meneame
- Blogger
- Amazon
- Yahoo Mail
- Gmail
- AOL
- Newsvine
- HackerNews
- Evernote
- MySpace
- Mail.ru
- Viadeo
- Line
- Comments
- Yummly
- SMS
- Viber
- Telegram
- JOIN
- Skype
- Facebook Messenger
- Kakao
- LiveJournal
- Yammer
- Edgar
- Fintel
- Mix
- Instapaper
- Copy Link
Introduction
Charts have been relevant for a long time and it’s unlikely they will be going anywhere anytime soon. Charts were invented over 200 years ago and remain in use to this day because they are a brilliant way to transmit information straightforwardly.
The thing with people is that we are largely visual animals. and this means that while we can understand text our brains interpret information much faster in the form of images. As such charts are the perfect way to offer complex numerical information in a way that everybody can understand, and they even have the advantage of being easily understood regardless of language or even age group.
However, while the appeal of charts can’t be underestimated, it’s also important to allow them to evolve. We’ve been using the same style of Office-based charts for decades, and right now there’s so much more we can do with them to provide clear information while also innovating and impressing our guests.
It’s all about JavaScript
Charts have changed a lot in the past few decades, and currently, we have access to more advanced and more unique chart designs than ever, but almost all of this progress comes down to JavaScript. For those of you unaware JavaScript is a programming language that now sees wide use on almost all platforms. JavaScript is considered to be one of the core technologies of the internet, with roughly 97% of all websites relying on it to some degree. But what does this means for charts?
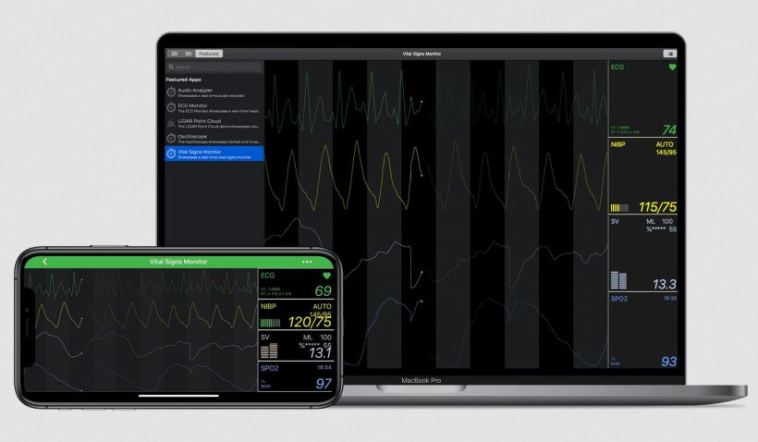
Well, JavaScript has also been used extensively to develop charts, and JavaScript Charts have a lot of advantages compared to their traditional counterparts. The most important thing about these new JavaScript-based charts is that they are dynamic. A chart using this programming language can be updated in real-time as new information is supplied to it, and can even be programmed to gather this information and add it to its results in real-time.
On top of that with these new technologies, new styles of dynamic charts have come to the forefront. A JavaScript Digital Line Chart for example can be used to portray the changes of a variable over time and also in real-time. And the interactive nature of JavaScript means that it’s possible to interact with specific moments of the line. A JavaScript Mountain Chart works similarly to a line one, but allows for multiple variables and offers a much more pleasing visual style.
Where to start?
If you want to improve your chart game you’ll need to get software specialized in JavaScript, in which case we recommend SciChart. This robust software suite allows you to make countless designs of charts and is available on multiple platforms so you will have ensured compatibility with all platforms. Their customer support is also spotless so if you are interested in what JavScript offers to the world of charts you don’t need to look further than SciChart.